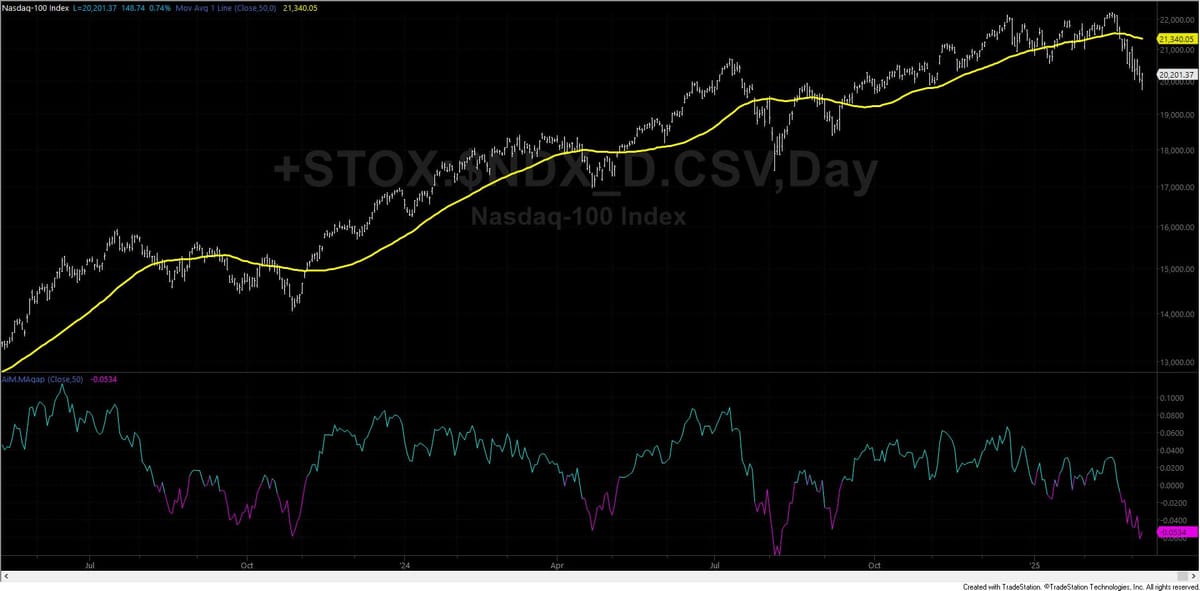
AiM.MAgap

This indicator study for TradeStation calculates and plots the percentage gap between the closing price and its moving average on daily charts. It helps traders visualize when prices are significantly above or below the average, potentially indicating overbought or oversold conditions.

AiM.MAgap

Key Features

  1. Calculates a simple moving average using the AverageFC function
  2. Computes the percentage gap between the closing price and the moving average
  3. Color-codes the plot to distinguish between positive and negative gaps
  4. Designed specifically for daily charts
  1. Open a daily chart for your desired ticker symbol.
  2. From the EasyLanguage shortcut bar, select "Indicators" and choose AiM.MAgap.
  3. Apply the study to your chart.

Note: This study is designed for daily charts only and will not function on other timeframes.

How To Apply

  1. Open a daily chart for your desired ticker symbol in TradeStation.
  2. From the EasyLanguage shortcut bar, select "Indicators" and choose AiM.MAgap.
  3. Apply the study to your chart.
  4. Note: This study is designed for daily charts to calculate meaningful realized volatility.

Inputs to Adjust

  1. Price (default: Close): The price data used for calculations. You can change this to Open, High, Low, or a custom price calculation.
  2. Window (default: 50): The number of bars used to calculate the moving average. Adjust this to change the sensitivity of the indicator.

Interpreting the Results

  1. The study plots a single line representing the percentage gap between the closing price and its moving average.
  2. Cyan color indicates the price is above the moving average (positive gap).
  3. Magenta color indicates the price is below the moving average (negative gap).
  4. Larger positive values suggest the price may be overbought relative to its average.
  5. Larger negative values suggest the price may be oversold relative to its average.
  6. Crossovers of the zero line may indicate potential trend changes or trading opportunities.

Additional Information

This indicator is best used in conjunction with other technical analysis tools and not as a standalone trading system. Always combine this analysis with sound risk management practices.

Note: This study is designed for educational and informational purposes only. It should not be considered financial advice. Always conduct your own research and consider consulting with a financial advisor before making investment decisions.

Subscribe to ActiveInvestorMag.com

Get a free weekly recap of top market insights from our Active Investor Magazine Subreddit—straight to your inbox!
jamie@example.com
Subscribe

This website is for informational and educational purposes only. It does not constitute financial advice, recommendations, or an offer to buy or sell any securities. All investments carry risk, including the potential loss of principal.
Please read our Terms of Service.