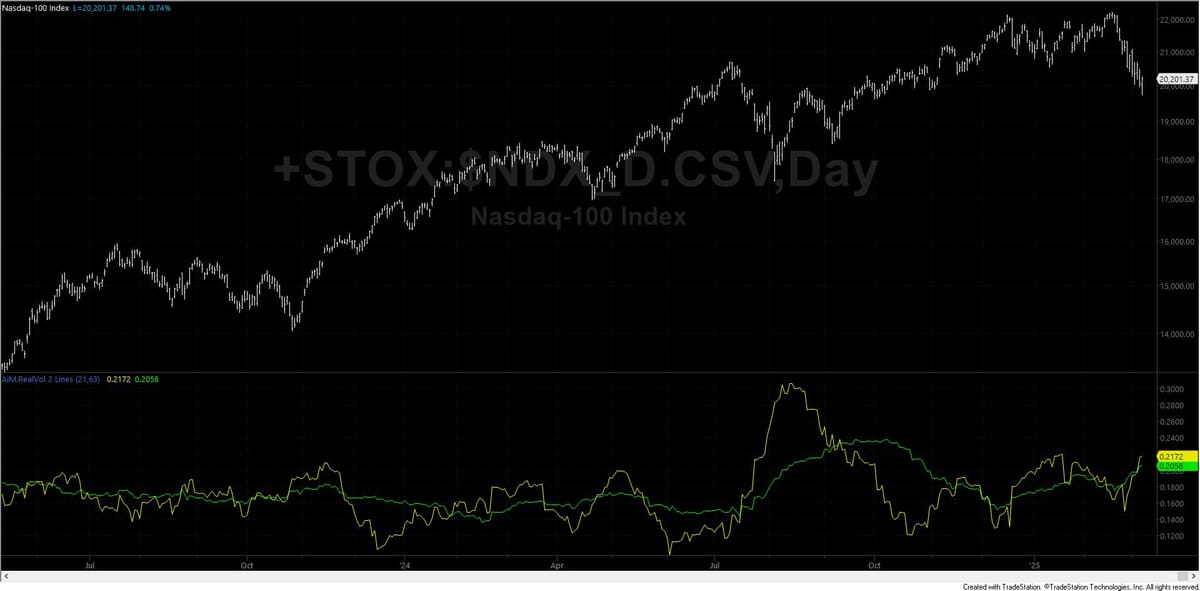
AiM.RealVol (2 lines)
This indicator study for TradeStation calculates and plots realized volatility over two different time periods on daily charts. It helps traders compare short-term and long-term volatility, potentially identifying changes in market conditions and risk levels to inform trading decisions.
This post is for subscribers only
Already have an account? Sign in.