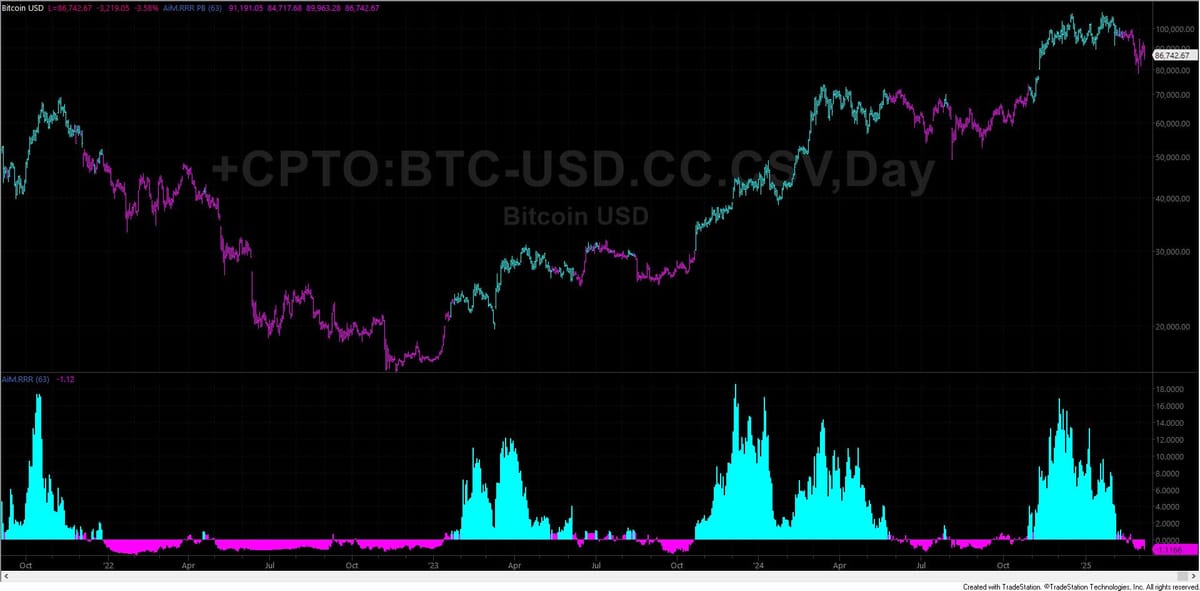
AiM.RRR and AiM.RRR PB
This pair of studies for TradeStation calculates and plots the Reward-to-Risk Ratio (RRR) as an indicator and, separately, paints the bars of daily charts to help traders assess the potential reward relative to the risk of price movements over a specified period.
This post is for subscribers only
Already have an account? Sign in.