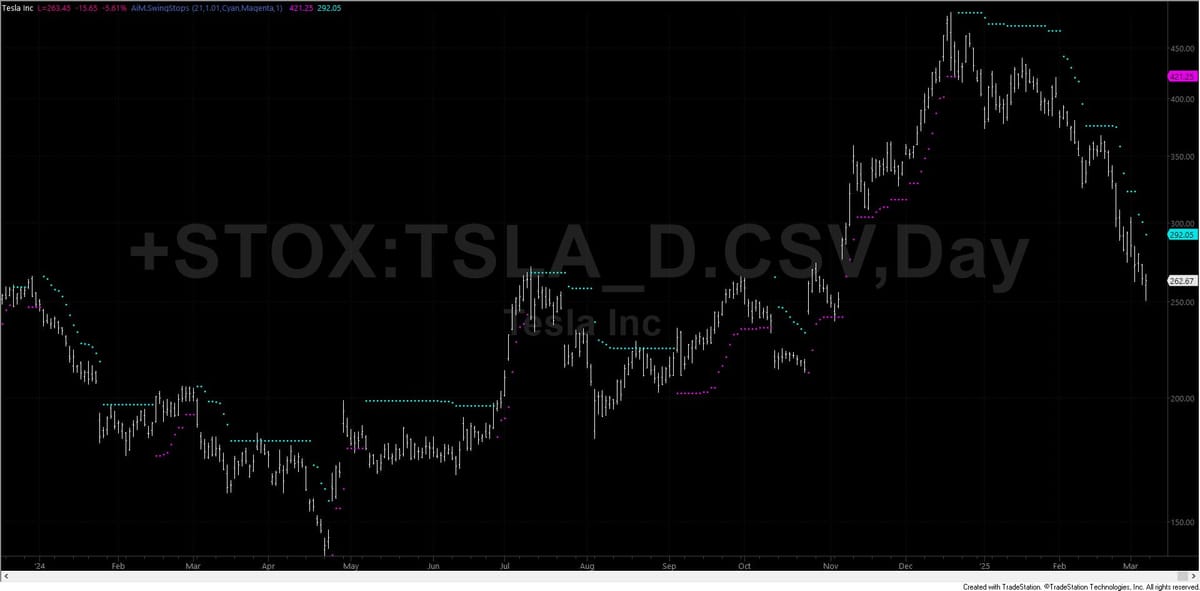
AiM.SwingStops

This indicator study for TradeStation is designed to help traders determine dynamic stop-loss levels for daily charts as well as identify entry points within a trend by calculating adaptive stop levels that adjust to changing market conditions.

AiM.SwingStops

The study can be applied to both charts and RadarScreen. It calculates and plots two adaptive stops: a magenta sell stop for long positions and a cyan buy stop for short positions.

Key Features

  1. Measures recent market volatility and provides asymmetric risk assessment of positive and negative price movements
  2. Plots two adaptive stops: a magenta sell stop for long positions and a cyan buy stop for short positions
  3. Includes alert functionality when price approaches calculated stop levels
  4. Adjusts stop levels based on recent price action and volatility

How to Apply

  1. Open a daily chart for your desired ticker symbol in TradeStation.
  2. From the EasyLanguage shortcut bar, select "Indicators" and choose AiM.SwingStops.
  3. Apply the study to your chart.
  4. Note: This study is designed for daily charts only and will not function on other timeframes.

Inputs to Adjust

  1. Window (default: 21): The number of trading days used for calculating volatility. Users can select up to 63 days.
  2. PctToStopAlert (default: 1.01): Determines how close the price needs to be to the stop level before triggering an alert

Adjust these inputs based on your personal risk tolerance and trading strategy.

Interpreting the Results

  1. The magenta dots represents the sell stop for long positions
  2. The cyan dots represents the buy stop for short positions
  3. When price crosses these dots, it may indicate a potential exit or reversal point
  4. Alerts will be generated when the price approaches the calculated stop levels

Additional Information

  1. The study requires at least as many bars as specified in the Window input (default 21) to calculate accurately
  2. You can adjust the colors of the plotted lines and the background in the study's properties
  3. If you experience performance issues, consider increasing the 'Maximum number of bars study will reference' in the study's properties

Note: This study is designed for educational and informational purposes only. It should not be considered financial advice. Always conduct your own research and consider consulting with a financial advisor before making investment decisions.

Subscribe to ActiveInvestorMag.com

Get a free weekly recap of top market insights from our Active Investor Magazine Subreddit—straight to your inbox!
jamie@example.com
Subscribe

This website is for informational and educational purposes only. It does not constitute financial advice, recommendations, or an offer to buy or sell any securities. All investments carry risk, including the potential loss of principal.
Please read our Terms of Service.