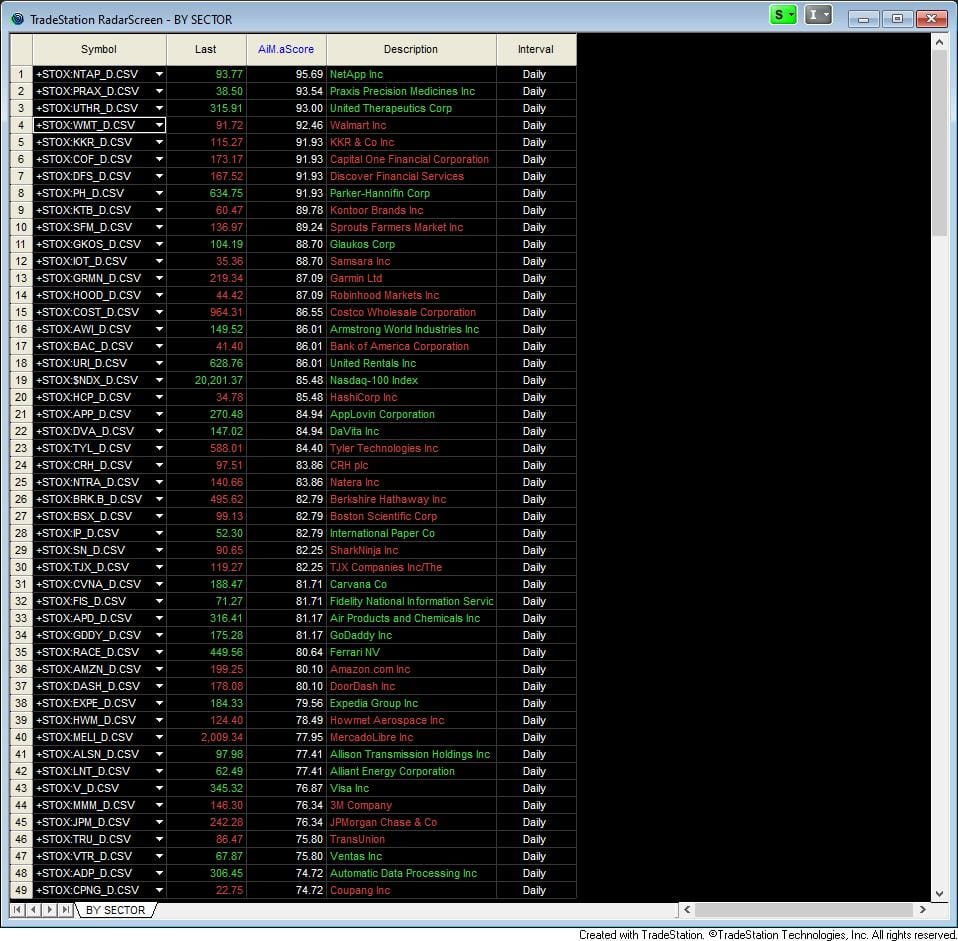
AiM.aScore

This indicator study for TradeStation calculates combines measures of empirical properties of asset returns and ranks these components against their historical values, providing a composite score that helps traders identify potentially significant market movements and changes in trading conditions.

AiM.aScore

Key Features

  1. Designed for daily charts
  2. Ranks empirical properties of asset price returns such as range, volume, and volatility against historical data
  3. Combines rankings into a weighted Action Score
  4. Adjusts weighting when volume data is unavailable

How to Apply

  1. Open a daily chart for your desired ticker symbol in TradeStation or RadarScreen.
  2. From the EasyLanguage shortcut bar, select "Indicators" and choose "AiM.aScore".
  3. Apply the study to your chart.

Note: This study is designed for daily charts only and will not function on other timeframes.

Inputs to adjust

  1. Window (default: 21): Lookback period for volatility and range calculations.
  2. Observations (default: 63): Lookback period for percentile rank calculations.

Adjust these inputs based on your preferred short-term and long-term analysis periods.

Interpreting the Results

  1. The indicator plots a single value (aActionScore) ranging from 0 to 100.
  2. Higher values (above 70) suggest potentially significant market action with above-average range, volume, and volatility.
  3. Lower values (below 30) indicate relatively quiet market conditions.
  4. The score is a weighted average of range, volume, and volatility rankings.
  5. Sudden increases in the score may signal emerging trading opportunities or potential trend changes.
  6. Consistent high or low scores can help identify persistent market regimes.

Additional Information

  1. If volume data is unavailable, the score is calculated using only range and volatility.
  2. The indicator uses percentile ranks to contextualize current market conditions against historical data.
  3. Consider using this indicator in conjunction with other technical analysis tools for confirmation.
  4. While designed for daily analysis, the principles can be applied to longer-term market analysis by adjusting the input parameters.
  5. Remember that high Action Scores don't necessarily predict price direction, only potential significance of market movements.

Note: This study is designed for educational and informational purposes only. It should not be considered financial advice. Always conduct your own research and consider consulting with a financial advisor before making investment decisions.

Subscribe to ActiveInvestorMag.com

Get a free weekly recap of top market insights from our Active Investor Magazine Subreddit—straight to your inbox!
jamie@example.com
Subscribe

This website is for informational and educational purposes only. It does not constitute financial advice, recommendations, or an offer to buy or sell any securities. All investments carry risk, including the potential loss of principal.
Please read our Terms of Service.