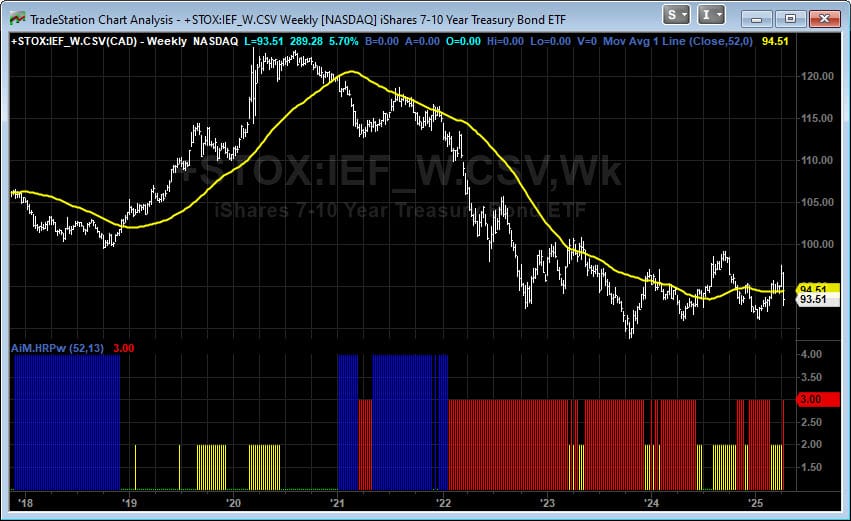
AiM.HRP
This indicator study for TradeStation categorizes market conditions into four distinct states. It combines trend and volatility measures to provide a comprehensive view of market dynamics, helping traders identify potential long-term trend shifts and market regime changes.

Key Features
- HRP stands for Historical Risk Profile.
- Specifically designed for monthly chart analysis
- Combines trend following and volatility metrics
- Ranks current market conditions against historical data
- Categorizes market state into four quarters based on trend and volatility
How to Apply
- Open a monthly chart for your desired ticker symbol in TradeStation or apply to RadarScreen.
- From the EasyLanguage shortcut bar, select "Indicators" and choose AiM.HRP.
- Apply the study to your chart.
Note: This study is designed for monthly charts only and will not function on other timeframes. The parameters are hard-coded in the indicator.
Interpreting the Results

The indicator plots a single line representing the "Zone" or market state:
- Zone 1: Low volatility, uptrend, roughly equivalent to Weinstein Stage 1
- Zone 2: High volatility, uptrend, roughly equivalent to Weinstein Stage 2 although very few uptrends actually crash UP to the point of entering Zone 2
- Zone 3: High volatility, downtrend, roughly equivalent to Weinstein Stage 3
- Zone 4: Low volatility, downtrend, roughtly equivalent to Weinstein Stage 4
- Transitions between zones may indicate potential changes in market regime or trading opportunities.
- The indicator considers both the current trend and volatility relative to historical patterns
Note: On our weekly stock ranking workbook, stocks in Zone 1 are colored green, Zone 2-yellow, Zone 3-red, Zone 4-blue.
Additional Information
- The indicator stores and analyzes up to 2000 data points for historical comparison.
- Consider using this indicator in conjunction with other technical and fundamental analysis tools for a comprehensive market view.
- As this is a long-term indicator, it's particularly suitable for position traders and investors focusing on extended market cycles.
Note: This study is designed for educational and informational purposes only. It should not be considered financial advice. Always conduct your own research and consider consulting with a financial advisor before making investment decisions.