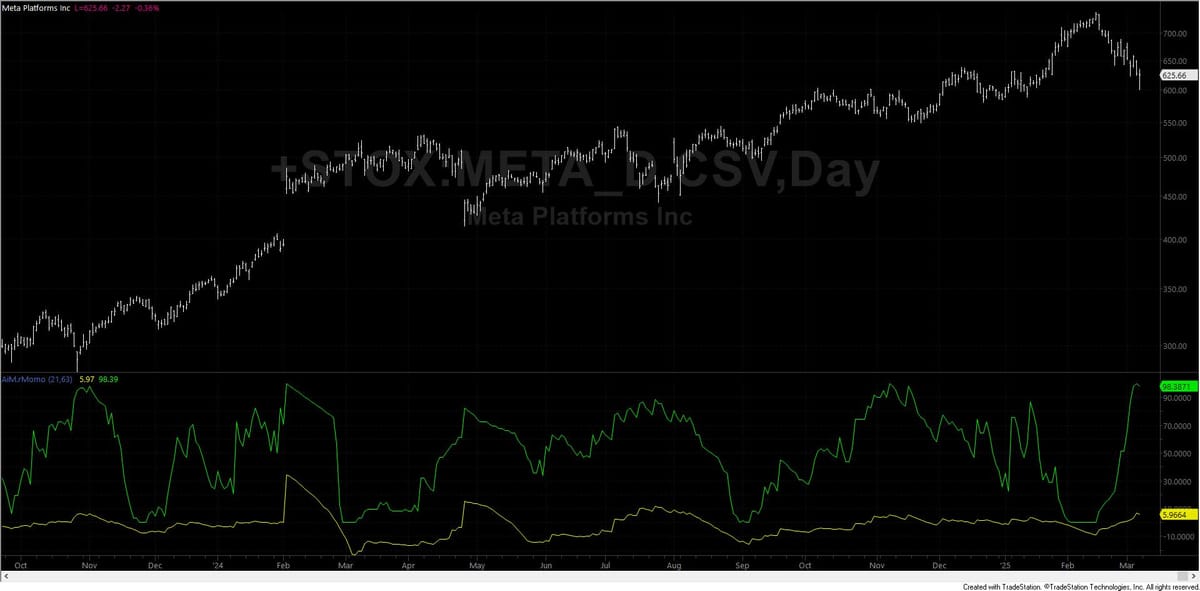
AiM.rMomo
This indicator study for TradeStation compares short-term and long-term volatility to identify potential shifts in market dynamics and ranks the current volatility spread within its recent historical context.

Key Features
- Computes the spread between short-term and long-term volatility
- Provides a percentile rank of the current spread
- Uses a 0-100 scale for easy interpretation
- Gives more weight to recent price movements in volatility calculations
How to Apply
- Open a chart for your desired ticker symbol in TradeStation.
- From the EasyLanguage shortcut bar, select "Indicators" and choose AiM.rMomo.
- Apply the study to your chart.
- Adjust inputs if desired (see below).
Inputs to Adjust
- ShortWindow (default: 21): The number of bars for short-term volatility calculation.
- LongWindow (default: 63): The number of bars for long-term volatility calculation.
Interpreting the Results
- Spread (Plot1): Shows the difference between short-term and long-term volatility. Positive values indicate higher short-term volatility.
- SpreadRank (Plot2): Ranges from 0 to 100, indicating the percentile of the current spread within the recent historical context.
- High SpreadRank values (above 80) suggest unusually high short-term volatility relative to long-term.
- Low SpreadRank values (below 20) indicate unusually low short-term volatility relative to long-term.
- Crossovers or extreme values in both plots may signal potential changes in market regime or trading opportunities.
Note: This study is designed for educational and informational purposes only. It should not be considered financial advice. Always conduct your own research and consider consulting with a financial advisor before making investment decisions.